Should You Rely on RSI in Forex?

April 30, 2018 at 7:18 am

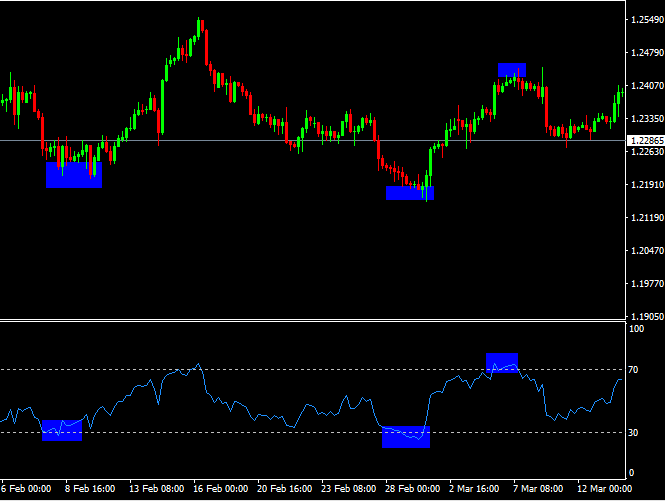
The Relative Strength Index is probably one of the most popular price indicators and it is being used by those traders who are at the beginning with forex trading. However, the indicator might be misleading for most of the traders, as they fail to understand it properly, which leads to some painful mistakes. In this article, we will cover the basics of RSI and we will also try to answer the question: Is RSI good for Forex trading?

General Information about RSI

What is RSI?

It is a technical indicator used to measure the strength of a particular trend, based on the closing price for a given period of time. The most popular period is 14, but other ones could be used, as well. The indicator can have a value between 0 and 100, with two levels being used as a threshold in order to determine in what kind of environment a particular asset is in.

If the RSI is located around or below the 30 level, that means we are in an oversold condition. A value above the 70 level will mean that an overbought condition is in play. Simple enough to understand, but some particularities will need to be taken into account in order to use the indicator properly.

Is RSI reliable?

It could be, but you must apply it in a certain context. Technical analysis is like an art, it can be mastered with time and in order to do that, you must practice and go over a lot of mistakes.

Now, getting back to RSI, let’s take an actual example from the chart. You can see below the EURUSD on the 4h chart and three situations we’ve spotted, two oversold and one overbought.

RSI trading

You can see that the market started to move in the opposite direction each time. The first thing to take into account is to use the indicator on a higher time frame. You could find signals on the smaller time frames, but it will most likely generate a lot of false signals.

The second thing and the last is to take signals that form on the dominant side of the market. In the example above, the pair had been in a bullish trend and buying the pair on oversold conditions would have generated strong signals, as it is highlighted on the chart.


Understanding the Market Rhythm

April 26, 2018 at 7:21 am

An ordinary forex trader will go out and learn technical analysis, fundamental analysis, and sentiment analysis, as all the books and online courses are saying, but only a few go deeper than that and learn some subtle details of the market. That is what we are going to do today, as we aim to explain a bit what the market rhythm is and how it could help you to anticipate recurrent patterns in the market.

What does rhythm have to do with Forex?

Well, it does. The market functions exactly like a car piston. It cannot move in a single direction, without moving in the opposite. No matter how an impulsive trend it, if you zoom on the smaller time frames, you will see counter trend players. Their influence is small, but it exists. Now, this series of moves on both sides sometimes has predictable unfolding.

Let’s see an example from the chart, to explain the concept better.

Below we have the EURUSD on the 1h chart, a pair which had performed very well in 2017. What we have spotted there is a series of legs that are similar to each other.

Market rhythm

The legs a, c, e, and g are considered consolidations on the other side of the dominant trend. On the other hand, legs b, d, f, and h, are impulsive moves in the dominant side of the market, since they cover more ground.

What we can notice there is this pattern of small consolidations followed by impulsive moves occurring four. This is what we mean by market rhythm. Is a recurring behavior of price which can lead to an anticipation of the future movements.

What you need to understand, though, is that not all the moves will be exactly the same. The length will be different, maybe some of them will cover more ground than the others. In such a liquid environment like the forex market, it is possible. What is important is to develop your focus and discipline in order to be able to spot this kind of price structure. Combined with a technical strategy it can lead to successful forex trades, for sure.


How to Think Outside of the Box in Forex

April 22, 2018 at 7:18 am

You’ve probably heard this phrase a lot of times and you haven’t manage to understand it. Also, even though you manage to understand, you don’t really find a way to apply it, so your actions will evolve for the better. Today we’ll cover this topic related to market psychology and mindset of trading and hopefully, you will be able to get what this is all about. We must say from the start that thinking outside of the box is a skill that can be practiced with time, so don’t worry if you are not able to master it right now.

Crowd behavior and its bad consequences

The Forex market is formed of a large number of people – a crowd and the way it evolves over is a result of the actions this large group makes. Some of them have a higher influence than other and so forth, but the bottom line is that crowd behavior drives the market.

If we analyze this crowd, we could see that we can split it into more categories. We will stick to just one of them- losers and winners, for the sake of the current subject.

People that are part of the winning side are able to understand the force of crowd behavior and anticipate what could influence that behavior in the future ahead. If they can anticipate the behavior that could lead to the anticipation of the market moves.

Forex mindset

Source: pexels.com

Thinking outside of the box simply means having a collateral view of the situation and managing to form objective conclusions. A person who thinks outside the box will never act impulsively and will never take a trading position just because he thinks all the people are doing that.

The crowd behavior is influenced by emotions and if we talk about professional forex trading, those emotions must not intervene in the decision-making process. That is why most of the people do not manage to generate profits. They act impulsively most of the time, while professionals manage to think outside of the box and anticipate future moves. Easy to talk about, but it can take years to master this skill, so make sure to start from now.


Risk Aversion and Forex Trading

April 15, 2018 at 7:18 am

In order to understand better the market psychology, this time we will discuss another interesting concept, which is the risk aversion. The current economic context is another reason why we want to approach this subject. The global economy had been expanding since 2011 and since 2009 in the United States. A recession is something normal in this case, as the economic cycles principle is stating. During those periods, risks aversion appears as the market sentiment deteriorates. Let’s dig into this subject and see what the particularities of this concept are.

What is risk aversion?

Risk aversion is a situation when the market participants are no more willing to invest their money in risky assets (stocks, precious metals, commodities etc) and place their money into safe assets (bonds, bank deposits etc.) due to economic contraction, political uncertainty, natural disasters or any other even with a significant negative impact on the economy.

Risk aversion

Source: https://www.publicspendforum.net

Periods with high-risk aversion have low market performance associated and thus returns are low, especially for long-term investors.

What should forex traders do during these periods?

What usually happens in the forex market is that investors are buying safe-haven currencies. We’ve covered the topic of safe-havens in a previous article and you can check it as well.

During the last severe economic crisis, which took place back in 2018, the yen, US dollar and the Swiss franc had been the biggest gainers, due to their safety profile.

Our assumption is that due to extreme nonconventional monetary policy from the Switzerland National Bank, the franc might not be able to gain as much as the yen or the US dollar.

The biggest economy of the world at this point, the United States, and US bonds are considered to be safe, that is why investors are selling currencies in order to buy US dollars so they will be able to buy bonds.

Also, following the crisis of 2018, the major central banks had embarked on a road of easy money, lowering rates and printing money, leaving them with little room for action in case another economic contraction takes place. Protection is the first objective when risk aversion is high and that is what you should do, as well, not expecting huge returns in short periods of time.


Basic Forex Trading Strategy

April 8, 2018 at 8:34 am

The trading strategy a forex trader chooses can be a defining tool for the future positive performance. This material had been designed for beginning forex traders that are searching for an effective trading strategy. What we need to mention from the start is that this strategy, like any other one, should be tested first. Forex trading demo account is a must, especially if you are at the beginning and you need to develop those skills required for you to generate consistent returns.

So, without further a due, let’s jump into the actual strategy that we want to talk about.

False breakout trading strategy

False breakouts happen many times in the forex markets, simply because support and resistance levels are not like a line in the sand. They are actually several layers deep and you will usually find the market breaking a certain support/resistance only to resume impulsively in the opposite direction.

This could be a great opportunity for you, but you need to learn how to do it. First, we must mention that this strategy should only be used for with trend trading. Do not even apply it for counter-trend trading.

Let’s show an actual example, so you could understand the strategy better.

Source:dailyfx.com

Above you can see the EURUSD chart on the 4h time frame. Since the beginning of 2018, the pair had a good performance, following around 13% gain in 2017.

We’ve drawn on the chart the 1.1941 level, which was a key support level. As you can see, the sellers managed to break it in the first place. Considering that the selling leg down was pretty impulsive, some of the traders might have assumed that the market will continue lower. The exact opposite happened and the price surged impulsively on the upside.

Let us know explain the basic rules of the system:

  • First, find the dominant direction of the market (the context)
  • Look for a key support/resistance level to which the market had responded in the past
  • Wait until that particular level had been broken on the other side of the dominant direction of the market.
  • For conservative traders, you can wait until the dominant side resumes and breaks again the level and tests it.

You can place stop loss below/above the false break formation, and target at least 2 or 3 times the stop loss value. This kind of setup had a good accuracy and over time it can be very effective.

As we’ve already mentioned, don’t forget the forex trading on demo account before you actually trade live, with your own money.

Risk Disclaimer
Foreign exchange trading carries high risk and may not be suitable for everyone. You should carefully consider before deciding to invest in speculative assets. No information contained in this article should be regarded as a decision to buy a certain asset.


The Canadian Dollar is Poised for Further Weakness

April 4, 2018 at 5:42 am

The Canadian Dollar has been trading under pressure as tariffs could weigh on the currency. The Bank of Canada delivered the widely expected lack of change, leaving the setting for the overnight rate at 1.25%. While higher rates over time remain implied by their economic outlook, they repeated that they will be cautious in considering future policy adjustments. Their views on recent developments were largely balanced, but with a notable mention of the growing uncertainty to Canada’s outlook posed by trade policy. The markets projection is for two more rate increases this year, in July and October, leaving a 1.75% setting by year-end.

The crucial final paragraph of the announcement was little changed relative to January. The repeat of “further rate hikes likely but guided by data and implemented with caution” is a place-holder as they observe the evolution of trade policy, wages, housing and GDP.

The Bank of Canada expects GDP growth of 3% in 2017 in-line with the Bank’s projection in the January monetary policy report. Yet that was largely due to higher imports, which mainly reflected stronger business investment. The key for policy going forward is the evolution of GDP and inflation relative to their projections. But uncertainty remains elevated, including the tariff plans from the White House in the United States making for a policy outlook that is written in very light pencil.

The March announcement revealed little change in the cautious, data dependent Bank of Canada. Hence, they should be able to hold policy steady until past mid-year, providing ample time to access the impact of NAFTA and possible U.S. tariffs on trade and investment. The long-anticipated rotation to export and business investment from household spending and housing is moving along in fits and starts. Of course, household spending did slow in Q4, which is something the Bank has been eying for some time. The announcement assured that they are continuing to monitor the economy’s sensitivity to higher interest rates, noting that household credit growth has decelerated for three consecutive months.

Three Rate Hikes in 2018

The Bank of Canada is expected to move again in July, lifting rates 25 basis point to 1.50%. Another 25-basis point rate hike is penciled in for October to leave a 1.75% rate that should close out the year. But the risk is intensifying that the economy faces fresh headwinds from trade and housing this year. Of course, an expanding U.S. economy would provide a strong tailwind for Canada, if trade protectionism does not weaken the link between the two nations. In other words, uncertainty clouds the outlook, leaving a gradual and cautious course ahead as the most sensible policy path for the Bank of Canada this year.

Canada housing starts improved

Canada housing starts improved to a 229.7k unit pace in February from a revised 215.3k growth rate in January. Currency trading of the Canadian Dollar saw the Loonie remain stable. The pick-up in starts was contrary to expectations for a mild dip and comes amid general softness in sales and prices so far this year as new mortgage rules and other measures pulled-activity ahead to late 2017. Starts saw a 6-month average of 225.3k in February versus 224.6k in January, maintain a steady growth rate since November of last year. Single detached starts fell 9.8% to a 56.7k rate in February while multiple urban starts jumped 15% to 154.5k in February. By region, starts improved in Toronto and Vancouver, with a record number of apartment starts featuring in Toronto.

Canadian Dollar